tl;dr. On macOS 27 (Golden Gate) the PMGR-owned channels in the IOReport “Energy Model” group
(CPU Energy, DRAM0, ANE0 and the per-cluster channels) stopped updating on every read.
They publish in batches. In a 14-minute trace on an M5 Pro the gaps between publications were
2.2 to 108.5 s, median 29 s. On the night I wrote this they did not publish at all for more
than 29 minutes, with the machine under heavy load. Between batches the running total and its
timestamp do not move, so any tool that computes watts as (energy delta ÷ sample interval)
prints 0.00 W, then a spike. macmon 0.8.2 printed cpu_power: 0.0 in 110 of 110 one-second
samples; in the 45 of them paired with SMC reads, the CPU rails read 21.6 to 57.8 W. The fix
has two parts: compute the rate over the driver’s own publication window (the timestamp sits at byte 24 of
RawElements) and say how old it is; and, where a model is calibrated, read CPU power from
the SMC rails instead, which update live and need no sudo.
Everything below was measured on one machine: a MacBook Pro Mac17,8 (M5 Pro, 6 Super + 12 Performance cores), macOS 27.0 (build 26A428), no sudo. Other chips are discussed at the end, with what I have not verified marked as such.
The symptom#
Open a terminal power monitor on macOS 27, load the CPU, and watch the CPU watts line. It sits at 0.00 W. Every so often it jumps to a number that is far too large (a naive 5 s delta over the trace below peaks at 589 W on a laptop), then drops back to zero.
Here is macmon 0.8.2 from Homebrew, run while the machine was busy with parallel Rust builds:
$ macmon pipe -s 5 -i 1000 | jq -c '{cpu_power, ram_power, sys_power, cpu_usage_pct}'
{"cpu_power":0.0,"ram_power":0.0,"sys_power":71.06655883789062,"cpu_usage_pct":0.9997713565826416}
{"cpu_power":0.0,"ram_power":0.0,"sys_power":73.3492431640625,"cpu_usage_pct":0.99995356798172}
{"cpu_power":0.0,"ram_power":0.0,"sys_power":73.44357299804688,"cpu_usage_pct":0.9992256164550781}
{"cpu_power":0.0,"ram_power":0.0,"sys_power":68.9784164428711,"cpu_usage_pct":1.0}
{"cpu_power":0.0,"ram_power":0.0,"sys_power":58.66642379760742,"cpu_usage_pct":0.9997719526290894}
That is 59 to 73 W of system power, the CPU at 100 % by macmon’s own count, and 0.0 W of CPU.
Across three runs that night (60, 45 and 5 samples) cpu_power, ram_power and ane_power
were 0.0 in every one of the 110 lines. For the 45-sample run I read the SMC at the same
time, once a second:
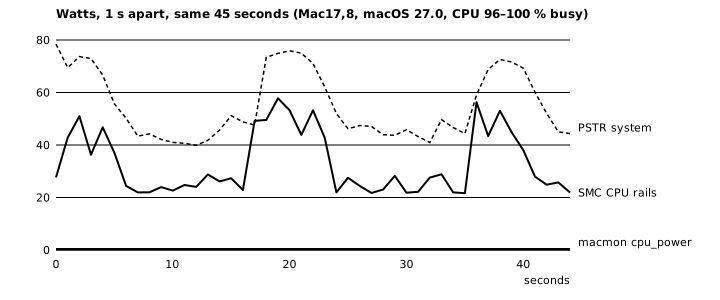
cpu_usage_pct stayed between 0.96 and 1.00. Green: the sum of six SMC CPU power rails.
Dashed: the SMC’s PSTR system power. Violet: macmon’s cpu_power. Captured 2026-09-24.macmon is the tool I measured. I am not singling it out: it is one of the best open IOReport clients, and on macOS 27 it does exactly what the counters tell it to. mactop and macpow read the same Energy Model group; I have not run them on macOS 27, so I will not claim what they print. The rule is simpler than a list of tools: if a sampler turns a per-interval delta of an Energy Model counter into watts, it reads 0 W on macOS 27 most of the time.
What about powermetrics?#
I did not run powermetrics for this post. It needs root, and the point here is what you can
read without it. powermetrics is itself an IOReport client, so it is plausible that it sees
the same batching, but plausible is not measured. If you have a macOS 27 machine and a minute,
sudo powermetrics --samplers cpu_power -i 1000 -n 30 next to the probe below would settle it.
I would like to see the result.
What changed: the Energy Model publishes in batches#
IOReport exposes energy as running totals. You subscribe to channels, take a sample, take
another, and subtract, and a one-second delta divided by one second is the average power.
Samplers like macmon are built on the assumption that every sample advances the counter.
(I have no macOS 26 capture from this machine to compare against, so “changed” rests on those
tools having worked before, not on my own before/after.) On macOS 27 the assumption fails for
the channels the PMGR driver owns
(AppleT6050PMGR on this chip). Each channel still has a running total, and each sample
still returns it, but the value only changes when the driver publishes a batch. The GPU is
different: GPU Energy belongs to the AGX driver, carries its value in nJ rather than mJ,
and advances on every read, which is why GPU watts still look normal in the same tools.
You can see the publications because every IOReport channel carries a driver-side timestamp.
It is not exposed by any IOReportChannelGet* accessor I know of, but it is in the raw
element. Each channel dictionary has a RawElements key holding a CFData whose layout
matches xnu’s IOReportElement:
| Offset | Size | Field |
|---|---|---|
| 0 | 8 | provider_id |
| 8 | 8 | channel_id |
| 16 | 8 | channel type (u8 format, u8 reserved, u16 category, u16 element count, i16 element index) |
| 24 | 8 | timestamp, mach absolute ticks |
| 32 | … | values |
The timestamp is in the same clock as mach_absolute_time(), so the age of the last
publication is (mach_absolute_time() − ts) × numer ÷ denom nanoseconds. On Apple Silicon
mach_timebase_info returns 125/3, one tick is 41.67 ns.
This is the probe output that made it obvious, one line every 5 s. CPU Energy and DRAM0
keep the same timestamp for 108 seconds while GPU Energy is always fresh:
CPU Energy ts=6414783475045 age=3.92s   val=593066166  GPU Energy age=0.00s
CPU Energy ts=6414783475045 age=8.94s   val=593066166  GPU Energy age=0.00s
...
CPU Energy ts=6414783475045 age=99.13s  val=593066166  GPU Energy age=0.00s
CPU Energy ts=6414783475045 age=104.14s val=593066166  GPU Energy age=0.00s
CPU Energy ts=6417386948088 age=0.67s   val=594067010  GPU Energy age=0.00s
(Trimmed from the capture: the DRAM0 columns, which move in lockstep, and the GPU values.)
The evidence#
The trace behind the charts below: 170 samples 5 s apart, 847 s in total, on 2026-09-23 while
the machine alternated between idle and parallel builds. It holds 23 distinct CPU Energy
timestamps, so 22 gaps.
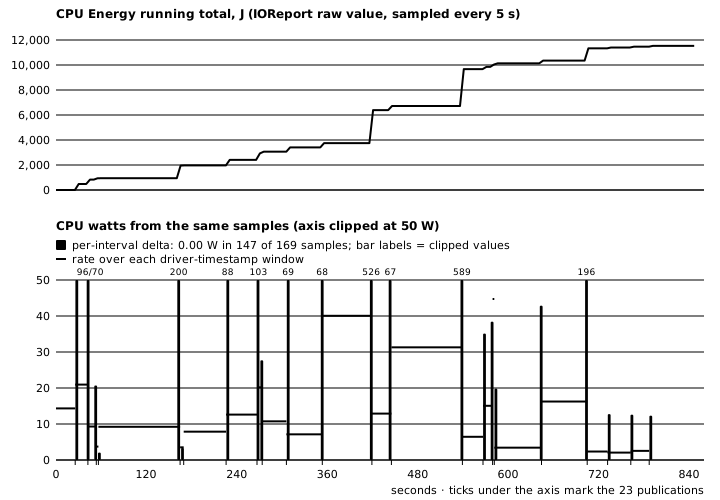
CPU Energy total. Bottom, violet: what a 5 s per-interval sampler
computes. Green: the same energy divided by the driver’s own window between publications.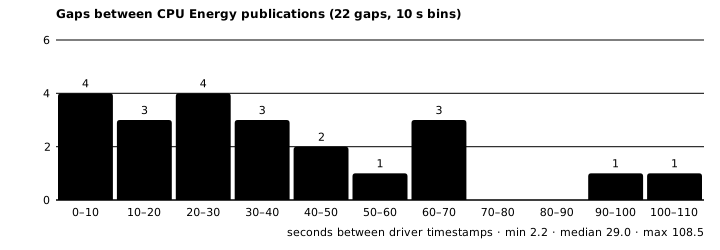
CPU Energy timestamps in the same trace.The numbers, computed from the trace (how, in Reproduce it):
| Value | |
|---|---|
| samples, 5 s apart | 170 |
| publications seen | 23 |
| gap: min / median / mean / max | 2.2 / 29.0 / 36.2 / 108.5 s |
| per-interval delta exactly 0 | 147 of 169 intervals (87 %) |
| largest per-interval “watts” | 589 W |
| rate over a publication window: min / max | 2.05 / 44.7 W |
A 5 s sampler still sees two publications inside one interval now and then, so gaps shorter than 5 s may be undercounted. At a 1 s interval the share of zero deltas can only go up.
And sometimes it stops#
The batches are not the worst case. At 21:15 on 2026-09-23, and again at 00:26 on 2026-09-24,
the CPU Energy timestamp was already about 23 minutes old when I started reading. The second
time I left a probe running at 1 s for 362.8 s under heavy load (1-minute load average 32 to 94
on 18 cores). The timestamp never moved: its age went from 1,397.96 s to 1,760.74 s, while the
GPU Energy timestamp advanced on every read. So the counter can go quiet for tens of minutes,
not just seconds.
I do not know what triggers a publication. Load alone does not: the silent window above was the busiest the machine had been all day. A new subscription does not either: every probe run creates its own, and none of them woke the counter. If you know, I would like to hear it.
Why per-interval deltas read 0#
Nothing is broken in the arithmetic. A typical sampler does this:
w = (E(t₁) − E(t₀)) / (t₁ − t₀) t = the sampler's own clockWhen no publication falls between t₀ and t₁, E(t₁) = E(t₀) and w = 0. When one does, the delta carries every joule since the previous publication, perhaps 100 s of them, and dividing by a 1 s interval gives a spike that is 100× too high. Averaged over a long run the energy is right. Any individual reading is wrong.
IOReportCreateSamplesDelta does not help. It subtracts the values of two samples, and
dividing its result by your own interval has exactly the same problem.
The fix: rate over the publication window#
The driver timestamp gives you the only interval the energy is actually known over. Use it.
- Keep only the roll-up totals.
CPU Energy,GPU Energy,ANE/ANE<n>,DRAM/DRAM<n>, and on multi-die chips the same names after aDIE_<n>_prefix. Match exact names. On this chip the group has 364 channels, and most of the CPU ones overlapCPU Energy: clusters (MCPU0,MCPU1,PCPU), cores (MCPU0_3,PACC_2),*_SRAMand dozens of*DTL*channels. Summing those instead of taking the total over-counts by about 3×. If a chip exposes both a package total and per-die totals, use the package total and sum dies only when there is none. - Read the raw sample, not the delta. For each kept channel take the running total
(
IOReportSimpleGetIntegerValue(ch, 0)), the unit (IOReportChannelGetUnitLabel:mJfor PMGR channels,nJforGPU Energy,uJ/µJon some others) and the timestamp at byte 24 ofRawElements. - Compute a rate only when the timestamp changes. Rate = (E₁ − E₀) ÷ (ts₁ − ts₀), both ends being publications. Ignore spans under about 10 ms.
- Hold that rate until the next publication, and say how old it is. A reading from 40 s ago is an honest 40-second average. Label it that way.
- Drop it when it is too old. plottypus uses 10 s. After that you do not know the power, and the correct output is “unknown”, not 0 and not the stale number.
- Reset on anything that breaks continuity: the total going down (counter reset), the
timestamp going backwards, or a wall-clock gap much longer than your cadence. That last one
is sleep;
mach_continuous_time()keeps counting through it, so compare the gap on that clock and start over instead of averaging across a lid-close.
In C, the core of it (a complete, compile-checked program is linked below):
// Running total (in joules) and driver timestamp for one channel of a raw sample.
double j = (double)IOReportSimpleGetIntegerValue(ch, 0) *
           joules_per_unit(IOReportChannelGetUnitLabel(ch));      // mJ -> 1e-3
uint64_t ts = 0;
CFDataRef raw = CFDictionaryGetValue(ch, CFSTR("RawElements"));
if (raw && CFDataGetLength(raw) >= 32)
    memcpy(&ts, CFDataGetBytePtr(raw) + 24, 8);                  // IOReportElement.timestamp

if (ts != ts_pub) {                                               // a new publication
    double span = (double)(ts - ts_pub) * sec_per_tick;          // 125/3 ns per tick
    held_w = (ts > ts_pub && span >= 0.01 && j >= j_pub)
                 ? (j - j_pub) / span                             // true average over the batch
                 : -1;                                            // reset: start over
    ts_pub = ts;
    j_pub = j;
}
double age = (double)(mach_absolute_time() - ts_pub) * sec_per_tick;
// show held_w with its age; show nothing once age > 10 s
The whole program is cpu-energy-hold.c (about 110 lines,
no dependencies beyond CoreFoundation and libIOReport). It prints the naive per-interval
figure next to the held one:
$ clang -O2 -Wall -o cpu-energy-hold cpu-energy-hold.c -framework CoreFoundation -lIOReport
$ ./cpu-energy-hold 1000 8
 t_s       naive_W        held_W      age_s
   1          0.00             -     1487.6
   2          0.00             -     1488.6
   ...
   8          0.00             -     1494.6
0 publications in 8 samples
That run landed in a silent stretch, so the held column is -: no publication, no number.
That is the right output. The wrong one is 0.00.
This gets you correct averages. It does not get you live CPU power. With 29-second batches you see a 29-second average, up to 29 seconds late, and with the long silences you see nothing. On chips where that is all you have, that is the honest ceiling.
The live alternative: SMC power rails#
The SMC is readable from user space through AppleSMC with no entitlement and no sudo. On
the Mac17,8 it holds 3,626 keys; 77 of them start with P, and all 77 are flt, in watts.
Two kinds matter here:
PSTR: total system power in watts. Read once a second, it changed on every read in my captures.- CPU rails: on the Mac17,8, the sum
PP0b + PP4b + PP1b + PP7b + PR0b + PR7btracks IOReportCPU Energy. From load tests,PP0b/PP4bfollow the Super cluster,PP1b/PP7bthe first Performance cluster andPR0b/PR7bthe second. Apple documents none of these keys; the mapping is inferred.
$ ./smc-rails 3 1000 PSTR PP0b PP4b PP1b PP7b PR0b PR7b
PSTR=69.949 PP0b=10.487 PP4b=0.921 PP1b=5.256 PP7b=0.864 PR0b=12.603 PR7b=0.639
PSTR=72.066 PP0b=27.584 PP4b=1.356 PP1b=7.731 PP7b=1.092 PR0b=11.762 PR7b=1.856
PSTR=76.261 PP0b=11.385 PP4b=2.610 PP1b=14.731 PP7b=1.776 PR0b=6.644 PR7b=0.733
smc-rails.c is the single-file reader behind that output (the
80-byte AppleSMC struct, selector 2, no dependencies).
Calibration#
“Tracks” needs a number. I recorded IOReport CPU Energy (value and driver timestamp)
next to the six rails and PSTR every ~0.27 s for 202 s, through idle and an 18-thread load
(760 rows). For every complete publication span I compared the IOReport rate with the mean of
the rail sum over the same span:
| Publication span | IOReport CPU Energy |
SMC rail sum (mean) | Ratio |
|---|---|---|---|
| 94.3 s | 31.30 W | 30.94 W | 0.99 |
| 27.3 s | 6.45 W | 6.11 W | 0.95 |
| 12.8 s | 15.06 W | 13.50 W | 0.90 |
| 2.2 s | 44.73 W | 44.58 W | 1.00 |
So on this model the rails read within about 10% of the IOReport figure (0.896 to 1.00× unrounded), slightly low, never high. (The capture started 14.2 s into a fifth span; it is left out because the rails did not cover it.) Four spans on one machine is a small sample. It is enough to use the rails as a live reading on this model and not enough to call them exact.
Two things to handle when you read them:
- At a load step the rails can lead
PSTRby up to 30 W for a read or two. If you clamp the CPU figure against system power (sensible: a CPU rail above total system power is a glitch), clamp against the maximumPSTRover the last few seconds, not the current value. - The first read after opening the SMC can return 0.0 for every rail. Treat an all-zero frame as “not populated yet”, not as 0 W.
Model-gated, on purpose#
The rail names differ between machines, and a wrong mapping produces a confident wrong
number, which is worse than none. The table in plottypus has exactly one entry, Mac17,8,
matched against hw.model. Every other model falls back to the held IOReport rate. If you
port this to another Mac, calibrate first: record rails and IOReport together across a few
publication spans and check the ratio. The two programs in this post, run side by side,
are enough to do it.
What it costs to sample#
IOReport is not free, and the cost is not where you might expect. Nearly all of it is kernel
time under IOReportCreateSamples (sample(1) stacks end in IOConnectCallMethod), and it is
roughly fixed per provider, not per channel. CPU time per sample on the Mac17,8:
| Subscription | Channels | CPU per sample |
|---|---|---|
| whole “Energy Model” group, sample + delta | 364 | 5.4 ms |
| “CPU Core Performance States” | 18 | 4.4 ms |
| energy roll-ups only | 4 | 5.5 ms |
| CPU core states + energy roll-ups, merged | 22 | 8.4 ms |
GPUPH residency only |
1 | 0.1 to 1.0 ms |
The first two rows are from the night of this post, on a loaded host; the rest from a scratch run on 2026-09-23. They move by a millisecond or two between runs. The shape does not: filtering 364 channels down to 4 saves almost nothing, and merging the energy roll-ups into a CPU residency subscription you already sample costs about the same as either alone.
The practical consequence: sampling the Energy Model every 250 ms costs about 2 % of a core
just in this call, to watch a counter that changes every half-minute. plottypus samples it
every 2 s, in the same subscription as CPU residency, which puts that sample at about
0.36 % of one core. The held value’s age is then accurate to ±2 s against a 10 s
stale limit. SMC reads are much cheaper per key, and PSTR plus six rails is seven keys.
Limitations and what I do not know#
- One machine. Every number here is from one Mac17,8 on macOS 27.0 (26A428). I have not captured M1–M4, other M5 variants or an Ultra on macOS 27. The batching is a PMGR-driver behaviour, so I expect it on other chips, but I have not seen it there.
- Rail calibration exists for one model. The SMC CPU rails are mapped and checked on the Mac17,8 only. On anything else, use the held IOReport rate or nothing.
- The trigger is unknown. Batches came 2 to 108 s apart on one evening and not at all for 29+ minutes on the next. I cannot tell you when the next one arrives.
powermetricsuntested. See above.- Apple can change this again. This is a private framework and undocumented SMC keys. A point release could restore per-read publication, change the batch cadence, rename the rails or remove them. The one thing that protects you is checking the timestamp: code that reads it keeps working whether publications come every second or every minute.
- Other PMGR channels.
DRAM0,ANE0and the per-cluster channels batch together withCPU Energy(their timestamps land within about 0.1 ms of each other). There is no SMC substitute for ANE or DRAM that I have found, so those stay “unknown” between batches.
Reproduce it#
You need Xcode’s command-line tools (the macOS SDK ships libIOReport.tbd). No sudo.
# 1. The hold/naive comparison (single file, prototypes included)
curl -O https://plottypus.com/media/post/cpu-energy-hold.c
clang -O2 -Wall -o cpu-energy-hold cpu-energy-hold.c -framework CoreFoundation -lIOReport
./cpu-energy-hold 1000 120          # 2 minutes; count the non-zero naive_W lines

# 2. The SMC rails and system power, live (rail names are Mac17,8's)
curl -O https://plottypus.com/media/post/smc-rails.c
clang -O2 -Wall -o smc-rails smc-rails.c -framework IOKit -framework CoreFoundation
./smc-rails 10 1000 PSTR PP0b PP4b PP1b PP7b PR0b PR7b

# 3. What a delta-based sampler prints (Homebrew macmon, if you have it)
macmon pipe -s 30 -i 1000 | jq '.cpu_power'
Things to look for: naive_W is 0.00 on most lines and occasionally very large; held_W
only appears after a publication; age_s climbs by one per line between batches. If on your
Mac naive_W is non-zero every second, your OS or chip does not batch, and I would like to
know which one it is.
The raw data behind every number in this post is published under CC BY 4.0, with checksums: the publication trace (847 s, 23 publications), the side-by-side runs of macmon, mactop and plottypus, and the SMC rail calibration. Catalogue: /data.
To turn a longer capture into the gap statistics above, log one line per sample with the driver timestamp and count how often it changes. The distinct timestamps are the publications; their differences, times 125/3 ns, are the gaps.
How plottypus uses this#
How to read the number on your own Mac, including the jq one-liner: Mac CPU watts in the terminal, no sudo.
plottypus 1.0.0 applies both halves. On the Mac17,8 its CPU watts come from the six SMC
rails, averaged over three reads and checked against recent PSTR; on every other Mac from
the IOReport CPU Energy rate held by driver timestamp, shown with its age and dropped after
10 s. ANE and DRAM are held the same way. System power is PSTR. Anything it cannot
currently measure is shown as —, never as 0 W. On this machine, during the silent stretch
described above, plottypus --json reported cpu_power: 20.69, sys_power: 50.66, and
null for ane_power and ram_power, which is the truth as far as anyone can read it
without root. It is a free download for Apple Silicon Macs:
curl -LO https://plottypus.com/download/v1.0.0/plottypus-v1.0.0-macos-arm64.tar.gz
tar xzf plottypus-v1.0.0-macos-arm64.tar.gz
./plottypus-v1.0.0-macos-arm64/plottypus --json | jq '{cpu_power, sys_power}'