What plottypus reads on Apple Silicon.Clusters, clocks, watts, heat, fans and processes. On this M5 Pro the CPU rails read 15–48 W.
plottypus is a system monitor for Apple Silicon that runs in your terminal. It never prints a zero it did not measure.
Measured with macmon 0.8.2 and mactop 2.1.5 on 24 Sept 2026 (the run). Live CPU watts on the M5 Pro. On other chips, the last IOReport value with its age (≈), then — once it is more than 10 s old, which on macOS 27 (Golden Gate) is often.
CPU watts, no sudoTemperature and fansWhy some tools read 0 WDocs
curl -fsSL https://plottypus.com/install.sh | shThe plottypus work screen at 160 by 45 cells. Six braille graphs over the last two minutes: CPU with its watts and temperature, GPU, memory and swap, heat with fan speeds, network, and power. On the right, the process list filtered to rustc.
the measurement
Same Mac, same 20 seconds
| tool | cpu watts, 1 sample/s | cpu W | at 0.0 | system W |
|---|---|---|---|---|
| macmon 0.8.2 | ⠀⠀⠀⠀⠀⠀⠀⠀⠀⠀⠀⠀⠀⠀⠀⠀⠀⠀⠀⠀⠀⠀⠀⠀⠀⠀⠀⠀⠀⠀⠀⠀⠀⠀⠀⠀⠀⠀⠀⠀⣀⣀⣀⣀⣀⣀⣀⣀⣀⣀⣀⣀⣀⣀⣀⣀⣀⣀⣀⣀⣀⣀⣀⣀⣀⣀⣀⣀⣀⣀⣀⣀⣀⣀⣀⣀⣀⣀⣀⣀ | 0.0 | 20 of 20 | 19–104 |
| mactop 2.1.5 | ⠀⠀⠀⠀⠀⠀⠀⠀⠀⠀⠀⠀⠀⠀⠀⠀⠀⠀⠀⠀⠀⠀⠀⠀⠀⠀⠀⠀⠀⠀⠀⠀⠀⠀⠀⠀⠀⠀⠀⠀⣀⣀⣀⣀⣀⣀⣀⣀⣀⣀⣀⣀⣀⣀⣀⣀⣀⣀⣀⣀⣀⣀⣀⣀⣀⣀⣀⣀⣀⣀⣀⣀⣀⣀⣀⣀⣀⣀⣀⣀ | 0.0 | 20 of 20 | 19–96 |
| plottypus 1.0.0 | ⣀⣀⣤⣤⣤⣤⣀⣀⣀⣀⠀⠀⠀⠀⠀⠀⠀⠀⠀⠀⠀⠀⠀⠀⠀⠀⣤⣤⣤⣤⣿⣿⣿⣿⣿⣿⣿⣿⣀⣀⣿⣿⣿⣿⣿⣿⣿⣿⣿⣿⣿⣿⣿⣿⣶⣶⣶⣶⣤⣤⣤⣤⣶⣶⣶⣶⣿⣿⣿⣿⣿⣿⣿⣿⣿⣿⣿⣿⣿⣿ | 15–48 | 0 of 20 | 19–104 |
MacBook Pro Mac17,8 (M5 Pro), macOS 27.0 (26A428), 2026-09-24, 00:39 IST, no sudo. The three tools ran at once: macmon pipe, mactop's headless JSON and plottypus --json-stream. Same scale on every row, 0 to 50 W.
Both tools saw the load. Their own system-power figures moved between 19 and 104 W in the same seconds. Only the CPU channel sat at zero.
The reason is upstream of them. On macOS 27 the PMGR “Energy Model” IOReport counters publish in batches 2–108 s apart, and sometimes not for tens of minutes. Divide one second's delta by one second and you get 0.0 W, then a spike. macmon is the tool plottypus learned IOReport from; its maintainers track this as issue #76. Stats users report the same 0.00 W in #3608 and #3621.
what it reads
Clusters, clocks, zones, rails and every process
Left: the chip summary (M5 Pro, 6 Super + 12 Performance cores, 20-core GPU, 24 GB), a GPU graph, a fan graph and per-core bars S0 to S5 and P0 to P11. Right: the super cluster at 14% and 2.5 GHz, and the super zone temperature at 74 degrees.
- per-cluster clocks
- Each cluster gets its own graph and clock, computed from IOReport P-state residency.
- zone temperatures
- From the SMC: 3,626 SMC keys on the M5 Pro, 285 temperature keys among them. No sudo, no helper daemon.
- per-core load
- Every core as a bar: S0–S5 and P0–P11 on the M5 Pro.
- power
- System, CPU, GPU, ANE and DRAM watts on one line, battery drain and time left beside them. Anything IOReport has not published is ≈ or —, never 0.
- interval
- 100 ms to 60 s, 500 ms by default. [ and ] change it live.
A process tree sorted by memory with columns pid, name, user, cpu percent, trend, gpu percent, mem, rss, power, read, write, wakeups per second and started. ollama-runner leads at 136% CPU, 88% GPU, 9.3 GB and 1.9 W.
honest by default
— when it does not know. Never a made-up 0.
- —
- No reading. Another user's process without root (the kernel answers EPERM), a sensor this Mac does not have, a watt figure older than 10 s. JSON prints
null. - ≈
- Held. Between macOS 27 batches plottypus keeps the last IOReport rate, timed by the driver's own timestamp, and shows its age next to it.
- ∅
- Not drawn. Hardware that is not there gets no panel: no fans on a fanless MacBook Air, no battery on a Mac mini. Anything under 0.05 W counts as absent.
self-cost
Cheap enough to leave open all day
1.5%[1]
of one core at the default 500 ms
0[1]
redraws while idle; one frame per sample otherwise
0.007W[1]
of its own, the kernel's per-task estimate
2.2MB[2]
one binary, nothing else installed
scripts/perf-smoke.py: 3 fresh processes, 5 s warm-up, 20 s window each, median. M5 Pro, macOS 27, median of 3, 160×45. About 1% of one core at 1 s. Before the rewrite it cost 7.06% of a core at 250 ms, 5.09% at 1 s and 0.18 W, with 106 empty redraws a second.- 2,166,064 bytes, arm64, ad-hoc signed, not notarized.
themes
It looks like your terminal
The default theme is auto. At startup plottypus asks the terminal for its own colours (OSC 10, 11 and 4), waits at most 120 ms, and builds every role from your palette. Over ssh it skips the question.
10 built-in themes besides. Glass mode notices a translucent Ghostty, kitty or Alacritty from its config file and leaves the background to the terminal.
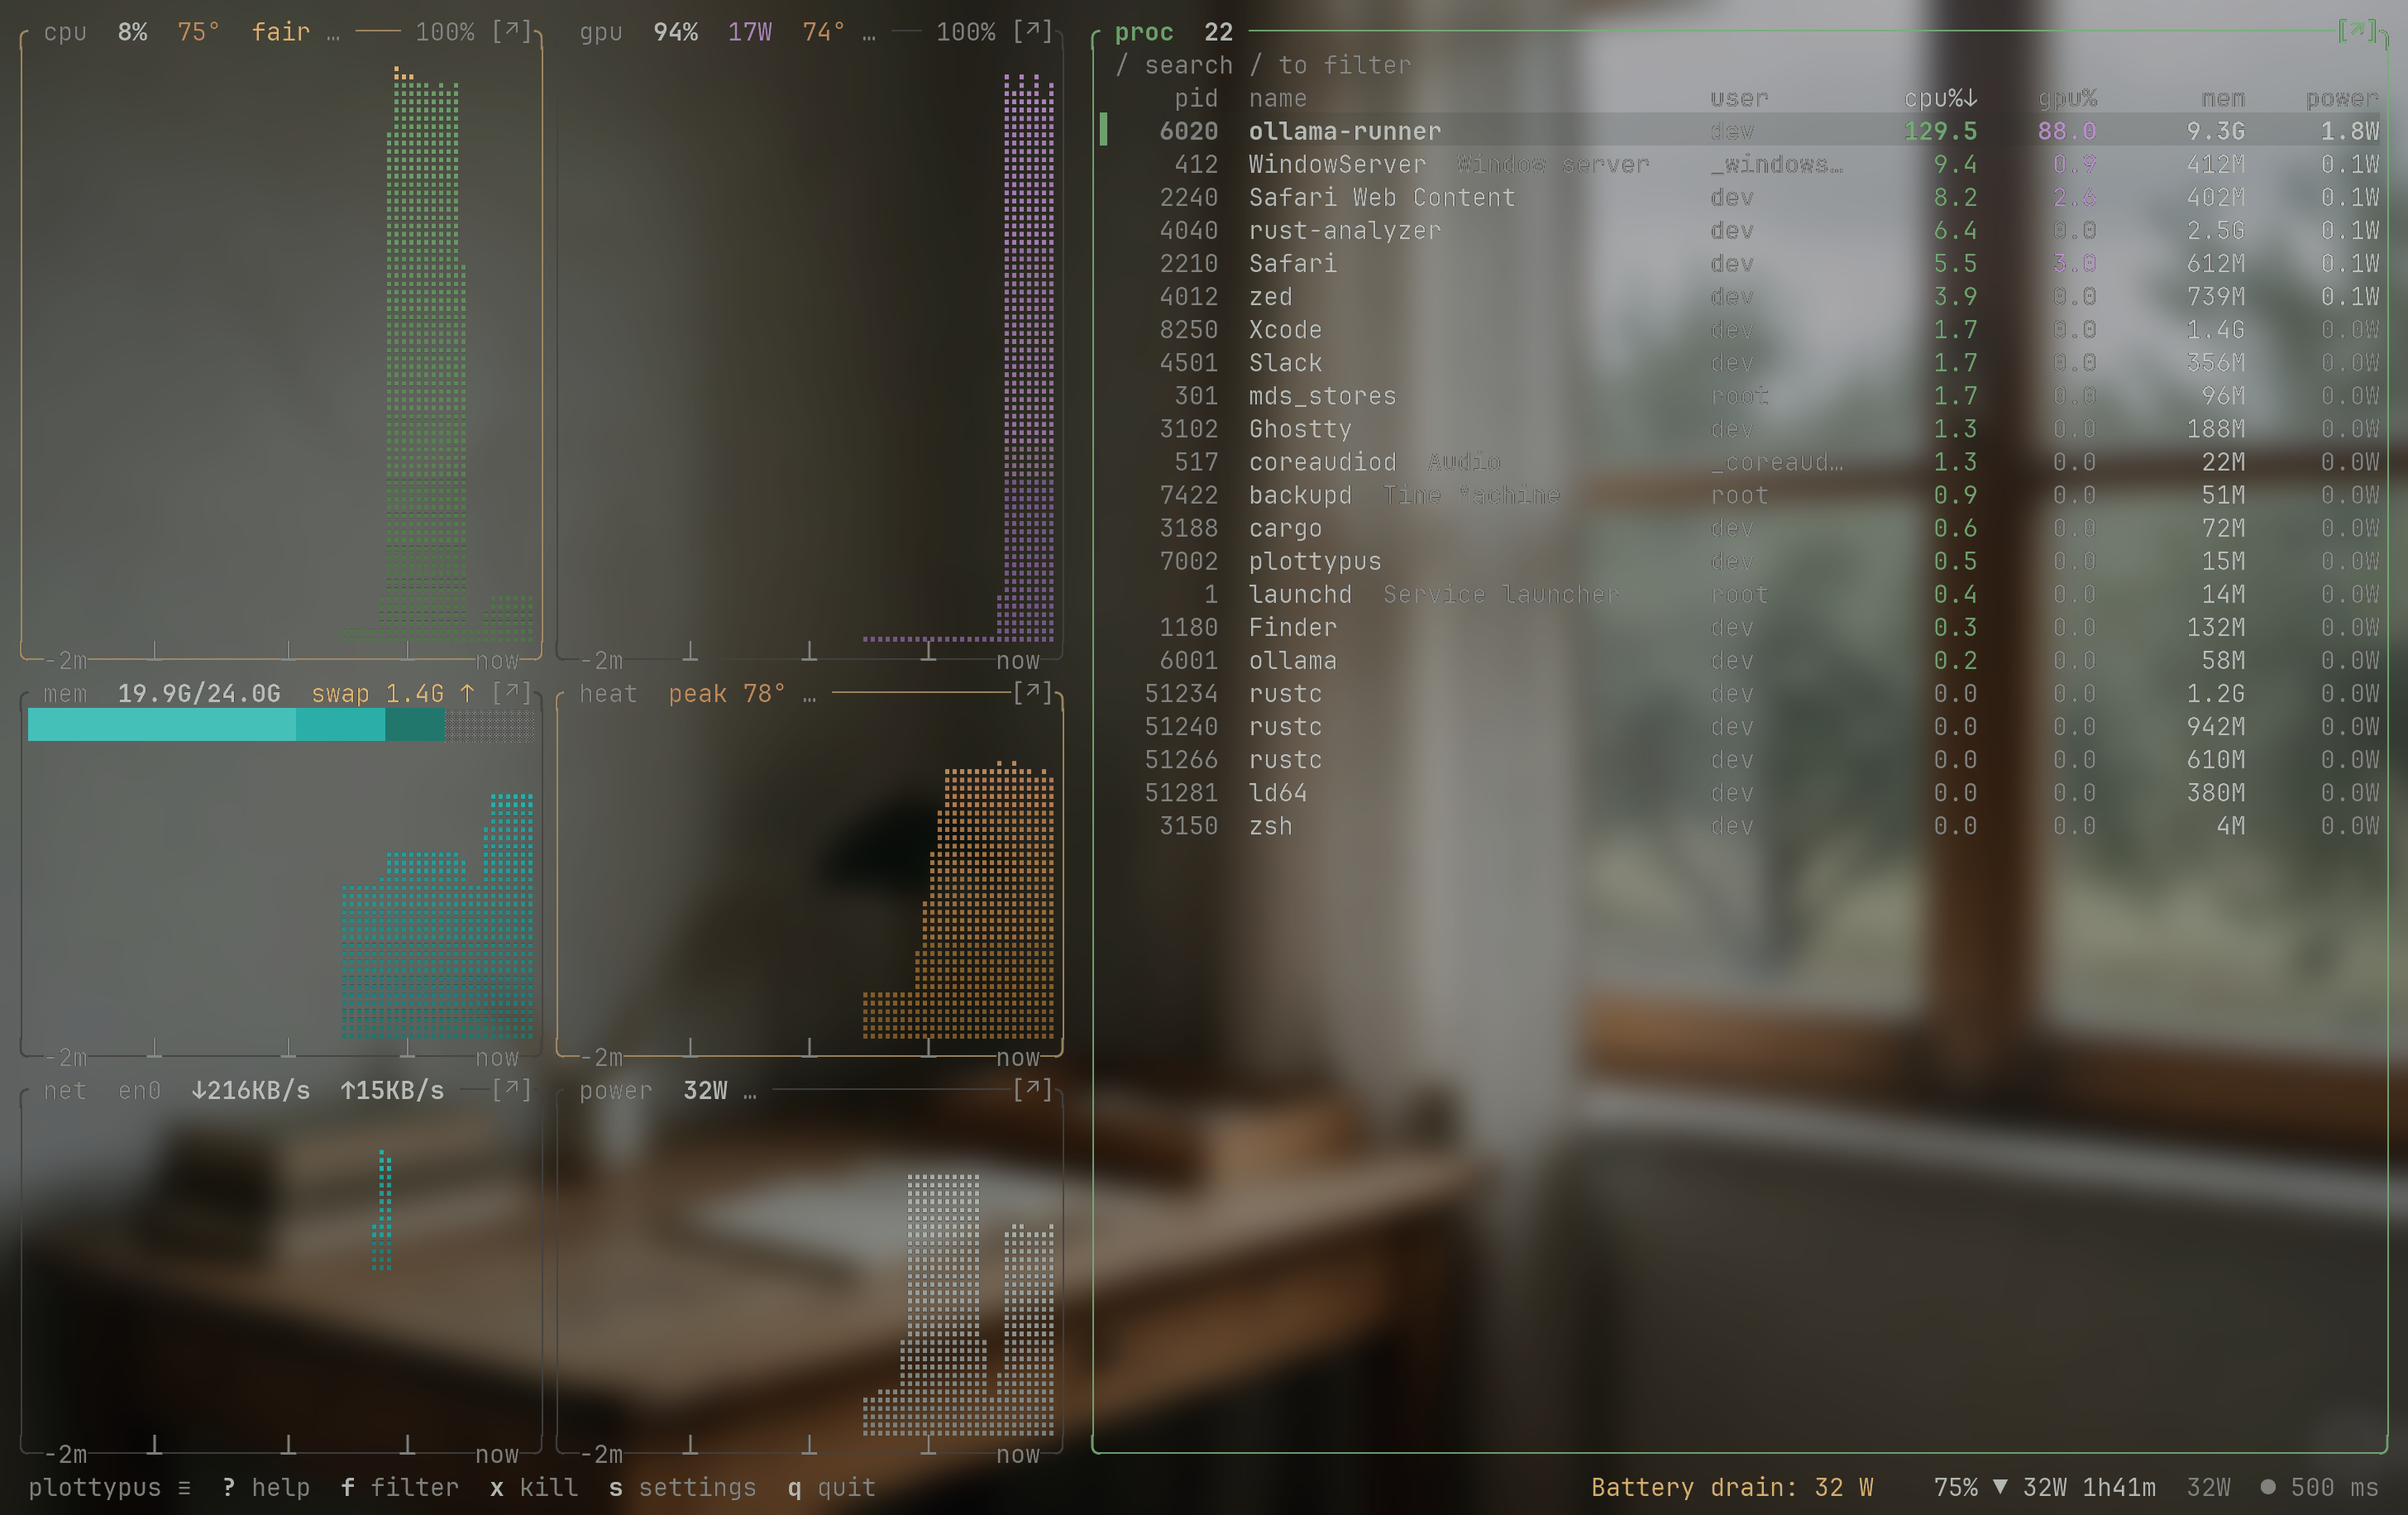
The same demo moment drawn in the selected theme.
keys and scripts
Keys you already know. Output you can pipe.
Key profiles
PLOTTYPUS_KEYS=htop or btop, or pick one in settings. The mouse works too: click a row, click a header to sort, drag the gutter.
| action | plottypus | htop | btop |
|---|---|---|---|
| help | ? | F1? | ? |
| settings | s | F2S | os |
| filter processes | / | F3/ | f/ |
| process tree | t | F5t | et |
| sort | o< | F6PMN | ←→ |
| quit process (TERM) | x | F9x | x |
| force quit (KILL) | K | K | K |
| pause sampling | p | Z | p |
| quit | q | F10q | q |
Scripting
JSON schema 1, macmon field names, null for unmeasured. --json prints one sample, --json-stream keeps going.
plottypus --json{
  "schema_version": 1,
  "unix_ms": 1790190745798,
  "interval_ms": 1000,
  "primed": true,
  "soc": {
    "name": "Apple M5 Pro",
    "e_cores": 0,
    "p_cores": 12,
    "s_cores": 6,
    "gpu_cores": 20,
    "memory_bytes": 25769803776
  },
  "cpu": {
    "usage": 1.0,
    "scaled": 0.9628398,
    "freq_mhz": 4289,
    "temp_c": 88.42795,
    …
  },
…plottypus --diagnoseBusy: rustc plottypus using 4.8 cores
- cpu active: 78%
- top process: rustc plottypus (pid 42415) at 4.8 cores
checked:
cpu 78% active, top rustc plottypus at 4.8 cores
memory 17.1G of 24.0G used, 711M swapped, pressure nominal
thermal nominal, cpu 77 °Csupported Macs
Apple Silicon, M1 to M5
- M5 Pro (Mac17,8)
- Live CPU watts from the SMC rails, within about 10% of IOReport. Run on hardware.
- every other chip
- CPU watts from IOReport, ≈ with an age, — after 10 s. Everything else as on the M5 Pro, from per-chip tables pinned by fixture tests.
- macOS
- Tested on macOS 27.0; the binary targets macOS 11+.
Beside the others
| tool | cpu watts on macOS 27 | sudo | lives in |
|---|---|---|---|
| plottypus 1.0.0 | 15–48 W, measured | no | terminal |
| macmon 0.8.2 | 0.0 W in 20 of 20, measured | no | terminal |
| mactop 2.1.5 | 0.0 W in 20 of 20, measured | no (fan control: yes) | terminal |
| Stats 3.0.17 | 0.00 W in user reports (#3608, #3621) | no | menu bar |
| btop 1.4.7 | not shown | no | terminal |
Measured rows: our M5 Pro, 2026-09-24. Stats: not run by us. btop has the look people copy, and it is cheap at its 2 s default (1.3% of a core on our M5 Pro, btop 1.4.7, measured 2026-09-23). Since 1.4.7 it shows Apple Silicon GPU watts; it does not show CPU watts on macOS.
price
Free now. Pro later.
Free. Every live reading stays free. Personal or commercial use, on any number of Macs, under the EULA. The source is not open.
Pro is not on sale yet. Planned: $9 at launch, then $12, one time, three Macs, every 1.x update. Built once the free launch passes 500 installs or stars. No waitlist, no email form.
faq
Questions a skeptic asks
Does it need sudo?
No. Every reading comes from calls an ordinary user may make: the SMC through IOKit, IOReport, HID sensors, Mach and sysctl. Root would only add other users' processes; without it their rows show — (on our Mac, 295 of 890 processes).
How accurate is it on M1 to M4?
It has run on one Mac so far, an M5 Pro (Mac17,8) on macOS 27.0. Other chips run from per-chip tables pinned by fixture tests. There, CPU watts come from IOReport: held with ≈ and an age between batches, and — once the last batch is more than 10 s old. If you have another chip, plottypus doctor prints what it can read; please send it.
Why is it free, and why is the source closed?
Free to use under the EULA. The source is not open. Free covers personal and commercial use on any number of Macs, and every live reading stays free. A paid Pro edition is planned for later; it is not on sale.
Does it touch the network?
The app makes no network connections: no telemetry, no update check, no crash reporter. The site sets no cookies. Vercel Analytics and Speed Insights count page views and load times.
Does it run on Intel Macs or Linux?
No. It reads Apple Silicon counters (IOReport channels, SMC keys, cluster residency), so it ships for arm64 macOS only.
What does — mean?
No reading. The kernel refused (EPERM for another user's process), the Mac has no such sensor, or a held watt figure is more than 10 s old. plottypus never prints 0 for a number it does not have; the JSON output prints null.
Why not sudo powermetrics?
powermetrics is Apple's own sampler and it needs root. plottypus reads the same class of counters without sudo and puts them next to clocks, temperatures, memory and processes on one screen.
install
One line, no sudo
curl -fsSL https://plottypus.com/install.sh | shplottypusThe script checks the SHA-256 before it copies anything, installs to ~/.local/bin (it prints the PATH line if that is missing) and never asks for sudo. A Homebrew tap is coming.
or by hand
plottypus-v1.0.0-macos-arm64.tar.gz (1.1 MB)
sha-256 89cdc2d1993dde0607d942103f393fb5bda6b38e1666ef96c3534d2c56e59f9b